Winery capacity planning using discrete-event simulation
When talking about the largest and most complex logistical challenges, people often default to thinking about industries like container shipping, airlines, or electricity distributions. Although few would initially put the wine industry on this list, wineries are a treasure trove of exciting operational challenges. OSI has delivered projects along all facets of the winemaking process for some of the biggest wineries in the US.
Our project developed an application that quantifies asset utilization under a variety of possible scenarios at a major US winery. Faulty demand forecasting had left our client with a costly gap between demand and their wineries’ capacity. The client wanted to have a better understanding of how changes to their winery assets, such as tanks, filters, and bottling lines, affect their utilization and overall capacity of their operations to better match their demand.
Winery assets
Wineries are a massively complex operation. The winery creates many hundreds of “base wines”, which are then combined as ingredients to the final wines you see on store shelves. Each base wine is distinguished not just by grape varietal and vintage but mainly by the process it has undergone: Different types of fermentations, different durations spent in barrels of different wood types, different flavorings that have been added, etc. Each of these hundreds of base wines has their own unique route through the winery, creating a complex network of batches using common resources.
Our model captures this entire operation in detail, from the raw grapes arriving by truck to the end of the bottling line. This allows the model to return a detailed report on the utilization of key assets such as.
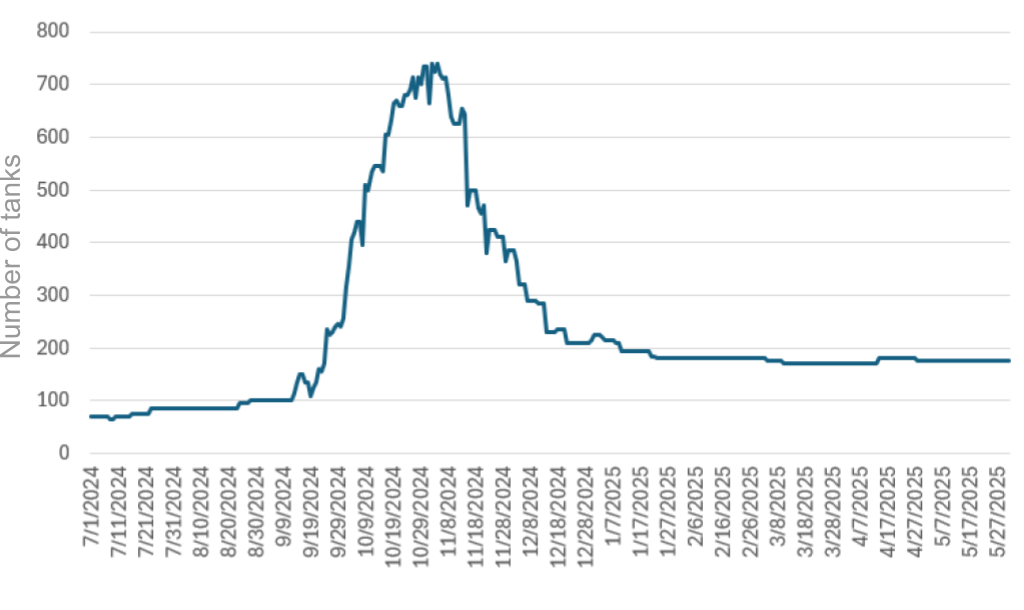
For example, the graph below shows the tank utilization for a group of tanks that is used primarily for fermentation. As expected, the utilization peaks during harvest season in the fall when arriving grapes start their fermentation upon arriving at the winery. The rest of the year, the tanks are used to a lesser extent for general storage.
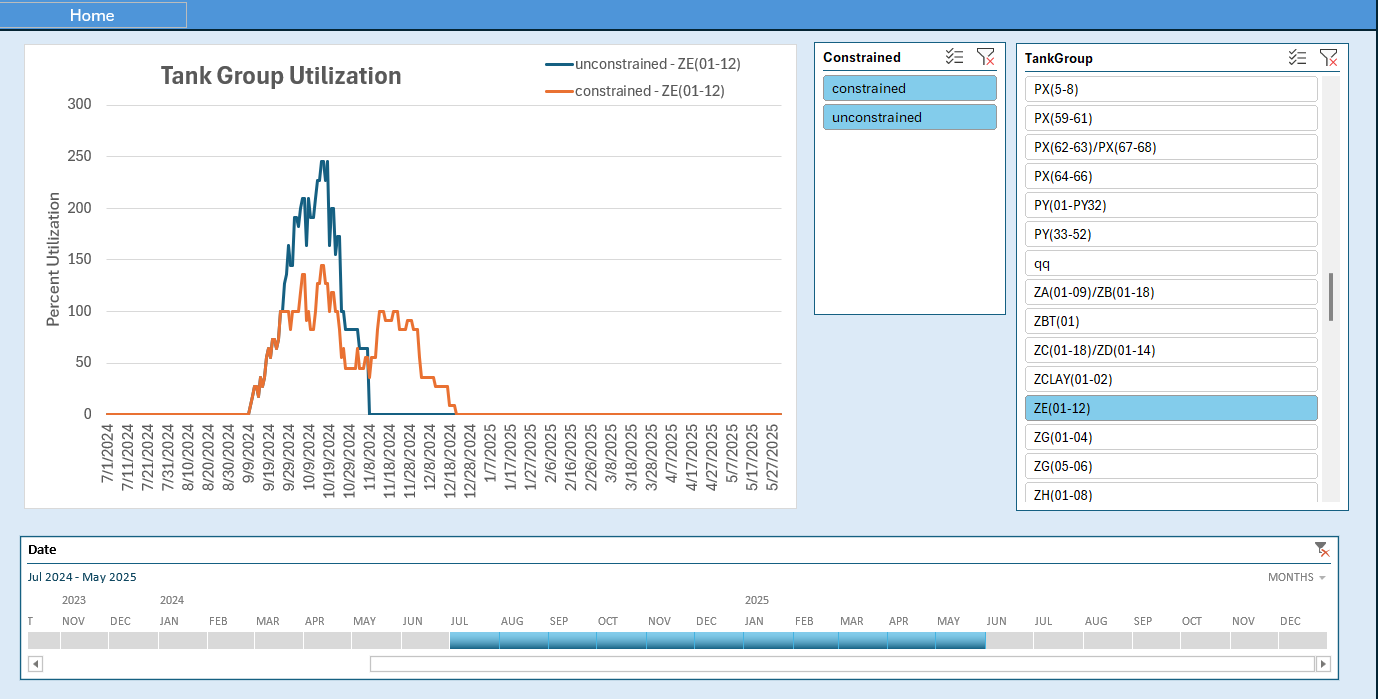
The application is wrapped inside an user-interface that allows users to run the model with the click of a button and view the utilization of each of their assets using dashboards like the one below..
Model inputs and scenarios
In order to achieve such a detailed model, we worked closely with our client to develop a database structure of tables that serve as the input for our model. These tables give our client fine control over the supply, demand, asset makeup, and routing of the batches
Changes to the input can represent all sorts of hypothetical scenarios for which the client would like to know the effects on capacity. These scenarios could include:
Discrete-event simulation
There exist many different mathematical frameworks for modeling logistical operations, each with their own unique strengths and drawbacks. The question of which framework to choose often depends on the characteristics of the particular project at hand and is a decision we deliberate carefully.
For the winery capacity model, the underlying framework is called discrete-event simulation (DES). This framework has a number of important advantages compared to mathematical optimization and integer programming, another popular technology OSI commonly leverages in their projects. Below we summarize the advantages of DES.
OSI prides itself in having deep expertise in a wide array of tools and techniques. We make sure that our clients can feel confident that their business problems are solved using the best and latest available methods.

Winery capacity planning using discrete-event simulation
When talking about the largest and most complex logistical challenges, people often default to thinking about industries like container shipping, airlines, or electricity distributions. Although few would initially put the wine industry on this list, wineries are a treasure trove of exciting operational challenges. OSI has delivered projects along all facets of the winemaking process for some of the biggest wineries in the US.
Our project developed an application that quantifies asset utilization under a variety of possible scenarios at a major US winery. Faulty demand forecasting had left our client with a costly gap between demand and their wineries’ capacity. The client wanted to have a better understanding of how changes to their winery assets, such as tanks, filters, and bottling lines, affect their utilization and overall capacity of their operations to better match their demand.
Winery assets
Wineries are a massively complex operation. The winery creates many hundreds of “base wines”, which are then combined as ingredients to the final wines you see on store shelves. Each base wine is distinguished not just by grape varietal and vintage but mainly by the process it has undergone: Different types of fermentations, different durations spent in barrels of different wood types, different flavorings that have been added, etc. Each of these hundreds of base wines has their own unique route through the winery, creating a complex network of batches using common resources.
Our model captures this entire operation in detail, from the raw grapes arriving by truck to the end of the bottling line. This allows the model to return a detailed report on the utilization of key assets such as.
For example, the graph below shows the tank utilization for a group of tanks that is used primarily for fermentation. As expected, the utilization peaks during harvest season in the fall when arriving grapes start their fermentation upon arriving at the winery. The rest of the year, the tanks are used to a lesser extent for general storage.
The application is wrapped inside an user-interface that allows users to run the model with the click of a button and view the utilization of each of their assets using dashboards like the one below..
Model inputs and scenarios
In order to achieve such a detailed model, we worked closely with our client to develop a database structure of tables that serve as the input for our model. These tables give our client fine control over the supply, demand, asset makeup, and routing of the batches
Changes to the input can represent all sorts of hypothetical scenarios for which the client would like to know the effects on capacity. These scenarios could include:
Discrete-event simulation
There exist many different mathematical frameworks for modeling logistical operations, each with their own unique strengths and drawbacks. The question of which framework to choose often depends on the characteristics of the particular project at hand and is a decision we deliberate carefully.
For the winery capacity model, the underlying framework is called discrete-event simulation (DES). This framework has a number of important advantages compared to mathematical optimization and integer programming, another popular technology OSI commonly leverages in their projects. Below we summarize the advantages of DES.
OSI prides itself in having deep expertise in a wide array of tools and techniques. We make sure that our clients can feel confident that their business problems are solved using the best and latest available methods.
